Hello! I’m glad these tools continue to be a useful resource for so many. I do regularly update this page when I find or develop new tools, but I don’t often check the comments posted here. If you have a question about any of these tools, feel free to reach out via email at kayla [dot] iacovino [at] nasa [dot] gov
Spreadsheets, Calculators, and Python Code
Stuff that I created or co-created.
TAS Diagram Plotter
Excel spreadsheet that allows for fast plotting onto a TAS (total alkali silica) diagram for use in naming your volcanic rock by composition. Created using coordinates as given in Le Maitre et al (2002).
Please cite as: Iacovino, Kayla, & Gouard, Cédric. (2021). TAS Diagram Plotter (3.0). Zenodo. https://doi.org/10.5281/zenodo.5907859
Version 3.0 New version by Cédric Gouard. Significant improvements and new features! Logic based on rock composition will now classify your rock type even further than the fields on the TAS diagram. For example, a trachybasalt may be further identified as a hawaiite or potassic trachybasalt; a basaltic trachyandesite may be further identified as a mugearite or shoshonite. The TAS diagram is now drawn in a more sensible way from formulae, and overall user friendliness is improved.
Version 2.0 The user can now resize the TAS diagram chart and keep the region boundaries in tact. Beware that the region labels may still move around relative to their fields, however.
TAS Diagram Plotter version en espanol
Hoja de Excel. Versión en español del trazador de diagramas TAS traducido del inglés por Crescencio Fernandez H.
Please cite as: Iacovino, Kayla, Gouard, Cédric, & Fernandez, Crescencio. (2021). TAS Diagram Plotter version en espanol. Zenodo. https://doi.org/10.5281/zenodo.5907888
Plutonic TAS Diagram Plotter
Excel spreadsheet based on the Volcanic TAS Diagram Plotter (v2.0) with updated parameters and labels for plutonic rocks. Created by Paul Asimow using coordinates and labels as given in E. A. K. Middlemost (1994).
Please cite as: Iacovino, Kayla, & Asimow, Paul. (2018). Plutonic TAS Diagram Plotter (1.0). Zenodo. https://doi.org/10.5281/zenodo.5907892
Version 1.0 Based on Volcanic TAS Diagram Plotter v2.0
DensityX: Glass Density Calc
Excel spreadsheet. Input the composition of a silicate glass/melt in terms of wt% and the H2O content in terms of wt% plus the temperature and pressure of the sample. Spreadsheet outputs the density of your glass/melt in terms of g/cm3 and g/L. User inputs go in blue boxes, output is automatically generated in red boxes.
Please cite as: Iacovino, K. and Till, C. B. (2019) “DensityX: A program for calculating the densities of magmatic liquids up to 1,627 °C and 30 kbar”, Volcanica, 2(1), pp. 1–10. doi: 10.30909/vol.02.01.0110.
References: Iacovino & Till (2019); Lange & Carmichael (1990); Ochs & Lange (1999); Also see Hack & Thompson (2011)
Excel Version 4.1
4.1: Updated molecular weight of H2O from 18 to 18.02 to match python code and web app. Updated 04 Apr 2023.
4.0: Updated to match DensityX python code version 1.1.0, which includes all changes made to the program in response to reviewers of the DensityX manuscript for publication in Volcanica.
3.2: Updated reference list to include all values and reference P and T values used. Updated 10 Apr 2017.
3.1: Minor tweaks to layout to clarify user inputs and program outputs. Fixed typo in reference temperature for H2O. Updated 29 Mar 2017.
3.0: Updated temperature dependence data to refer to correct reference temperature. Calculations now work at high temperature. Updated 26 Jan 2014.
🐍 DensityX Python Library
Github Repository. You can download the DensityX python library locally if you like. It can also be installed via pip “pip install densityx”.
🕸️ DensityX Web Tool
DensityX Web Tool. Online interface to the DensityX python library. Simply upload your file and run it!
Calculate fO2 Buffer
Excel spreadsheet. Tool to calculate oxygen fugacity in terms of the common buffers when logfO2 is known or for translating between fO2 values expressed in terms of various buffers. This is useful for converting calculated oxygen fugacity values into and between delta buffer values (e.g. ΔNNO, ΔQFM…).
Please cite as: Iacovino, Kayla. (2022). Calculate fO2 Buffer (1.5). Zenodo. https://doi.org/10.5281/zenodo.7387196
References:
B. R. Frost in Mineralogical Society of America “Reviews in Mineralogy” Volume 25.
Campbell, A. J. et al. High pressure effects on the iron–iron oxide and nickel–nickel oxide oxygen fugacity buffers. Earth Planet Sc Lett 286, 556–564 (2009).
French, B. M. & Eugster, H. P. Experimental control of oxygen fugacities by graphite‐gas equilibriums. J Geophys Res 70, 1529–1539 (1965).
Pownceby, M. I. & O’Neill, H. St. C. Thermodynamic data from redox reactions at high temperatures. IV. Calibration of the Re-ReO2 oxygen buffer from EMF and NiO+Ni-Pd redox sensor measurements. Contr. Mineral. And Petrol. 118, 130–137 (1994).
Holzheid, A. & O’Neill, H. St. C. The Cr-Cr203 oxygen buffer and the free energy of formation of Cr203 from high-temperature electrochemical measurements. Geochim Cosmochim Ac 59, 475–479 (1995).
Bygden, J., Du Sichen, and S. Seetharaman. “A thermodynamic study of the molybdenum-oxygen system.” Metallurgical and Materials Transactions B 25.6 (1994): 885-891.
Version 1.5
1.5 Fixed Re-ReO buffer (previously used log when ln should have been used). Credit Daniel Coulthard for the fix! 1 Dec 2022
1.4: Added equation for Mn-MnO buffer. Also flagged which reactions are calibrated only for 1 bar ( these equations have no pressure dependence). 19 July 2021.
1.3: Added equations for Graphite-CO-CO2 (GCO), Re-ReO, Cr-Cr2O3, and MoMoO2 buffers. Added “Translate from IW” tab. 3 June 2021.
1.2: Added equation for Si-SiO2 buffer. 28 May 2020.
1.1: Added ability to convert from a buffer value to the actual logfO2 value and into other buffers. Useful, for example, in comparing two data sets where one is expressed in terms of ΔNNO and the other in terms of ΔQFM. 6 October 2016.
🐍 Python Script: Oxygen Fugacity (Redox) Buffer Plotter
Python script that plots fO2 buffer values at any given pressure and temperature range. Right click the link above and “Save Target As…” and unzip the .zip file containing a python script and library. User should edit the file ‘create_plot.py’ and run this script to create a plot.
Please cite as: Iacovino, Kayla. (2021). Oxygen Fugacity (Redox) Buffer Plotter. Zenodo. https://doi.org/10.5281/zenodo.5907875
Update 6 July 2021 Fixed QFM, HM, CoCoO, and QIF equations to use pressure in bars instead of GPa.
Ferric/Ferrous, Fe3+/FeT, fO2 Converter (Kress and Carmichael, 1991)
Excel spreadsheet. Tool for calculating the ferric/ferrous iron ratio in a melt for any given fO2 and vice versa. Also calculates new wt% and mole fraction values for FeO and Fe2O3 in your melt. Useful for determining theoretical iron speciation when total is given as FeOtotal or Fe2O3total and fO2 is known. Can also calculate or recalculate FeO and Fe2O3 wt% from given Fe3+/FeT and FeOT (or existing FeO and Fe2O3 wt%).
Please cite as: Iacovino, Kayla. (2021). Ferric/Ferrous, Fe3+/FeT, fO2 Converter (Kress and Carmichael, 1991) (3.2). Zenodo. https://doi.org/10.5281/zenodo.5907844
References: Kress & Carmichael (1991); B. R. Frost in Mineralogical Society of America “Reviews in Mineralogy” Volume 25.
Version 3.2
3.2: Corrected error in cells J5 and J6, which were previously using an improper conversion coefficient (0.8998 instead of 2). January 2021.
3.1: Added tab for calculating FeO and Fe2O3 from Fe3+/FeT. December 2020.
3.0: Added all parameters for calculations at high pressure. Redesigned user interface. Added conversion from melt comp to fO2. 12 October 2018.
2.2: Fixed bug where dropdown box to choose oxygen fugacity buffer did not work. 11 October 2016.
Hydrous Melts Conversion Tool
Excel spreadsheet with VisualBasic macros. Tool for converting anhydrous composition of a silicate melt in wt% plus known mol fraction of volatiles in the melt (H2O and CO2 mixture) to a hydrous melt composition in terms of both wt% and mol fraction. I created this tool as part of an independent study during my undergrad. Also see the tutorial.
Wtper-to-Molper Conversion Tool
Excel spreadsheet with VisualBasic macros. Tool for converting (hydrous or anhydrous) melt composition from wt% to mol%.
Oxide to Element Conversion Tool
Excel spreadsheet that will convert compositions measured in oxides (SiO2, FeO, K2O, etc) to elements (Si, Fe, K, etc), and vice versa.
Please cite as: Iacovino, Kayla. (2019). Oxide to Element Conversion Tool. Zenodo. https://doi.org/10.5281/zenodo.5907879
Water From Iron Reduction
Excel spreadsheet. Great for experimental petrologists. If a silicate melt is “fused” or “pre-melted” at the same oxygen fugacity that the experiments are ultimately run at, the ratio of ferric to ferrous iron in the melt will remain unchanged. If, however, the melt is fused in air and then run at more reducing conditions, some of the Fe2O3 will be reduced to FeO and will add water to your melt in the process. Use this tool to calculate just how much water was added to your melt due to the reduction of iron during your run. Only works if pre-run fO2 is in air (i.e. all iron is Fe2O3 before run), but calculation can be made for any experimental fO2.
Please cite as: Iacovino, Kayla. (2020). Water From Iron Reduction (1.1). Zenodo. https://doi.org/10.5281/zenodo.5907885
References: Kress & Carmichael (1991); B. R. Frost in Mineralogical Society of America “Reviews in Mineralogy” Volume 25.
Version 1.1
External Spreadsheets and Calculators
Simple and extremely useful tools that I found online.
🐍 Link: Python Libraries for Earth Scientists
A curated list of python packages for use in the Earth Sciences by Maurizio Petrelli.
Link: Gabbrosoft Mineralogical Spreadsheets
Spreadsheets for calculating mineral formulas based on an electron microprobe analysis. The spreadsheet does all the hard work, so you don’t have to! Also find the Bulk KD calculator for calculating trace element bulk KD values given the mineral make-up of a sample, and the Magma Density calculator for calculating the density of a magma from its major element composition.
Link: Mineral Formula Calculations
Various excel spreadsheets from Carlton College. Useful tools for calculating formulas of various mineral types based on electron microprobe or EDX measurements (or anything where you have an analysis of a mineral in terms of wt% oxides).
Link: rockPTX
An excellent resource for optical petrology and mineralogy and some electron microscopy. This website is a resource put together by Frank Mazdab and contains numerous high resolution scans of thin sections (PPL and XPL) along with explanations of the mineralogy. Also lots of good tips for doing optical mineralogy.
Link: Chemical Equation Balancer
A fantastic tool that balances chemical equations (calculates reaction stoichiometry) and then allows for the calculation of moles or mass of product(s) given moles or mass of the reactant(s).
Models Available Online
Some of my favorite models, none of which were made by me but all of which are used by me!
Link: Papale model for H2O-CO2 partitioning/solubility in magmas
Calculate isobars, fluid/melt partitioning, saturation pressures, solubilities! Calculations straight from the model of Papale P, Moretti R, Barbato D (2006) The compositional dependence of the saturation surface of H2O + CO2 fluids in silicate melts. Chemical Geology 229, 78-95.
Link: MagmaSat for Mac
MagmaSat is a calculator that determines the saturation conditions for a mixed H2O-CO2 fluid in natural composition silicate liquids. The calculator implements the thermodynamic model of Ghiorso and Gualda (2015).
Link: VolatileCalc
This software calculates H2O-CO2-melt equilibrium for the rhyolite and basalt systems. The software is written as Visual Basic for Applications Macros within Microsoft Excel. Calculations from the model of Newman, S., Lowenstern, J.B., 2002, VolatileCalc: a silicate melt-H2O-CO2 solution model written in Visual Basic for Excel: Computers and Geosciences vol. 28 no. 5, pp. 597-604.
Link: SolEx
This model calculates basaltic melt and coexisting vapor compositions in the system C–O–H–S–Cl. In the forward model, total volatile inventories and melt composition are specified by the user. The parameterisation of Dixon (1997, p. 368) is used to predict the partitioning of CO2 and H2O between vapour and melt phases. An iterative procedure is employed to predict the partitioning of S and Cl components between fluid and melt phases. Melt and gas compositions and gas volume fraction are thereby modelled over pressures in the range 5–4000 bar. This approach satisfactorily reproduces independent literature data on S and Cl behaviour in basalt. SolEx is a user-friendly software package available for OS X and Windows, facilitating modelling of closed- and open-system C–O–H–S–Cl degassing in basalts. Computers and Geosciences vol. 45, pp. 87–97.
Link: MELTS, rhyoloiteMELTS, and pMELTS
MELTS is a software package designed to facilitate thermodynamic modeling of phase equilibria in magmatic systems. It provides the ability to compute equilibrium phase relations for igneous systems. MELTS works over the temperature range 500-2000 °C and the pressure range 0-2 GPa. rhyoliteMELTS is identical to the MELTS calibration but is adjusted specifically for silicic compositions containing quartz and feldspar (P/T range equal to that of MELTS). pMELTS is optimized for bulk mantle compositions and is suitable over the temperature range 1000-2500°C and the pressure interval 1-3 GPa.
Link: MELTS for Excel
MELTS for Excel is a macro-enabled Microsoft Excel workbook that provides a graphical user interface to set up, run, retrieve, and display calculations made with MELTS. Original publication: Gualda G.A.R., Ghiorso M.S. (2015) MELTS_Excel: A Microsoft Excel-based MELTS interface for research and teaching of magma properties and evolution. Geochemistry, Geophysics, Geosystems 16(1), 315-324 doi:10.1002/2014GC005545
Link: Model for Viscosity of Volatile-bearing Melts
From the paper Viscosity of magmatic liquids: A model by Giordano D, Russell JK & Dingwell DB (2008). Calculate the viscosity of a melt given composition, temperature, and H2O. The link above is a version of the model in javascript. There is also an Excel spreadsheet version.
Link: QUILF
QUILF is a program originally written in Pascal to assess equilibria among Fe-Mg-Mn-Ti oxides, pyroxenes, olivine, and quartz. The program can calculate mineral equilibria, P, T, and fO2 given the right parameters. Only works on Windows. This version of QUILF was made to run on Windows 3.1 and 95, but I have successfully run it on Windows XP. Be sure to read the QUILF Basics file, included in the zipped archive or as a standalone download.
Original publication: Anderson, DJ, Lindsley, DH, and Davidson, PM (1993) A Pascal program to assess equilibria among Fe-Mg-Mn-Ti oxides, pyroxenes, olivine, and quartz. Computers and Geosciences vol. 19, no. 9, pp. 1333-1350. doi:10.1016/0098-3004(93)90033-2
Thermodynamic Tools, References & Calculators
I always find it difficult to find the thermodynamic data that I need when I need it. So, I’m starting a running list here. Below are some references and online tools and tables that I consult often when I need to get my fugacity on.
Fugacity Coefficient Tables
Some very handy tables that are hosted as course materials for a geoscience class at Penn State.
Patrick Barrie’s program for solving cubic equations of state
A man to whom I owe a great debt, Patrick Barrie, has made this online applet for calculating Z, V, φ, H & S using a variety of equations of state, including the Redlich-Kwong. You must know critical temperature (Tcrit), pressure (Pcrit), and the acentric factor ω.
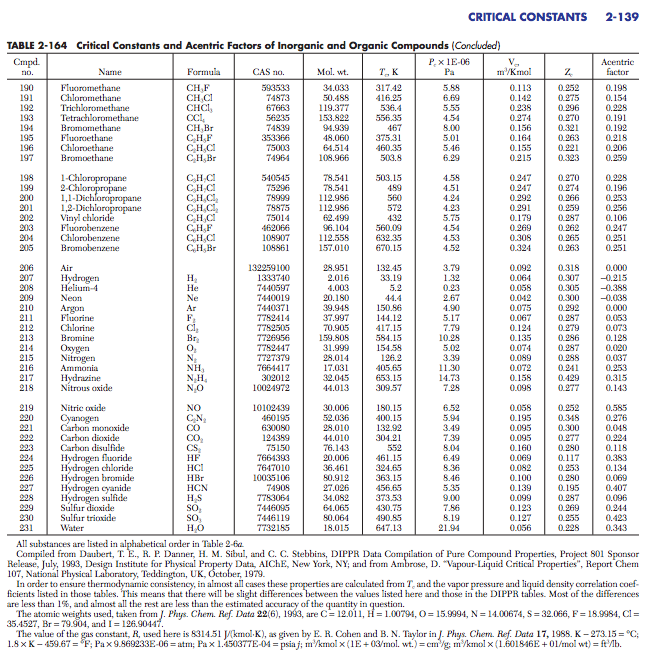
Critical Constants and Acentric Factors for Selected Fluids
A page out of the book Molecular Thermodynamics of Fluid-Phase Equilibria, Third Edition by John M. Prausnitz – University of California, Berkeley; Rüdiger N. Lichtenthaler – University of Heidelberg; Edmundo Gomes de Azevedo – Institute Superior Técnico, Lisbon
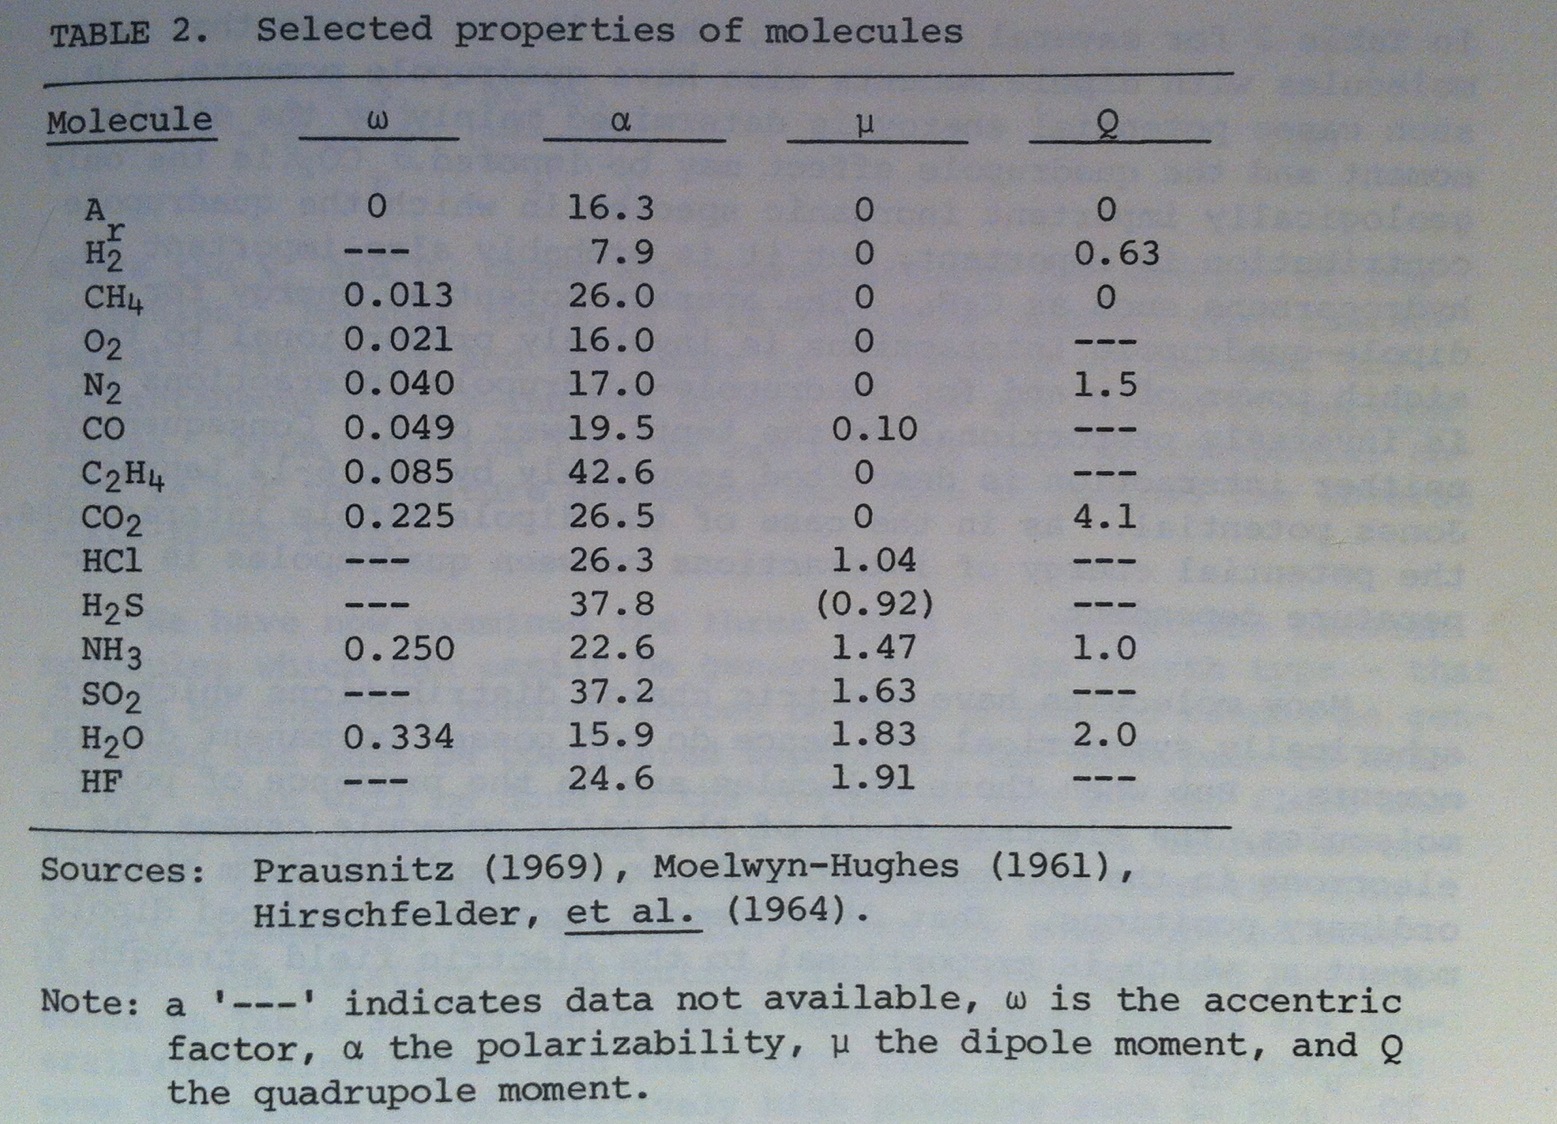
Selected Properties of Molecules
This is an image of Table 2 from Holloway (1977) Fugacity and Activity of Molecular Species in Supercritical Fluids. In Fraser, D.G., Thermodynamics in Geology, 161-181.
Thermodynamic Quantities for Substances and Ions at 25°C
Link to a table of values for ΔH, ΔG, and ΔS for various substances.
Heats, free energies, and equilibrium constants of some reactions involving O2, H2, H2O, C, CO, CO2, and CH4
Wagman et al. (1945). Paper with calculations and thermodynamic data for reactions involving the above species. This is useful when an equilibrium constant of reaction (rather than equilibrium constant of formation from the elements) is required. For example, when dealing with the reaction CO + 1/2O2 = CO2. Jump to Table 8 for equilibrium constant values.