On July 21st, 2015 at 2:41:14 local time, a 4.1 magnitude earthquake occurred in Fremont, California. This is the story of how the chemical analysis of a volcanic rock from North Korea at a facility in Stanford University recorded the event.
Much of the San Francisco area was jolted awake last night at 02:41:14 local time to that oh so familiar shaking of their homes that Bay Area residents have become accustomed to. I myself sat up in my bed in Milpitas (about 12 miles from the source of the shaking) along with the rest.
Was… was that an earthquake? I couldn’t be sure. I’m a pretty deep sleeper, and sometimes my dreams blend into my reality in those first few nanoseconds of consciousness. Fairly certain I didn’t imagine it, I snatched the cell off my bedside table and punched up Twitter. My timeline was already abuzz with cries of #EARTHQUAKE!
EARTHQUAKE!!!!!! #SanFrancisco
— Bonnie Burton (@bonniegrrl) July 21, 2015
JUST IN: Residents of the Bay Area are reporting an #earthquake. Where did you feel it from? #quake
— ABC7 News (@abc7newsBayArea) July 21, 2015
I didn’t feel the five aftershocks that continued to rattle Fremont during the night.
5 aftershocks in #Fremont (magnitudes 1.0, 1.9, 1.9, 2.1, and 2.7) since the 4.0 #earthquake at 2:41am. pic.twitter.com/RW9OH0XzTo
— KTVU (@KTVU) July 21, 2015
After confirming my suspicions and reporting the tremor on the USGS Did You Feel It? website, my next thoughts were to my precious — no, not my cats. They DGAF — samples.
I had spent the entire day prior programming an analytical instrument called the SHRIMP-RG, or Sensitive High Resolution Ion MicroProbe Reverse Geometry, located at Stanford University. I am using the SHRIMP to analyze the chemistry of volcanic pumices from a 1,000 year old eruption at Paektu volcano (North Korea). To vastly overly simplify an incredibly complex piece of machinery, it basically zaps my sample with an ionized oxygen beam generated by a thing called a duoplasmatron (seriously, that’s what it’s called!), sends the sample’s now ionized particles flying down a tube, through some magnets, and measures what comes out the other end. It’s used for chemical analyses of very very tiny things in very very minor abundances: things as small as 10 microns in diameter with concentrations of the chemical of interest as low as one part in one billion (1 ppb).
SHRIMP analyses can take a long time depending on what you’re measuring. Each single analysis of one of my samples takes about 18 minutes. Because I need so many tens of analyses, that can take several hours to days of analysis time. So, each day I program the locations of the regions that I want to measure into the computer and let it run over night while I sleep, which is what I did last night.
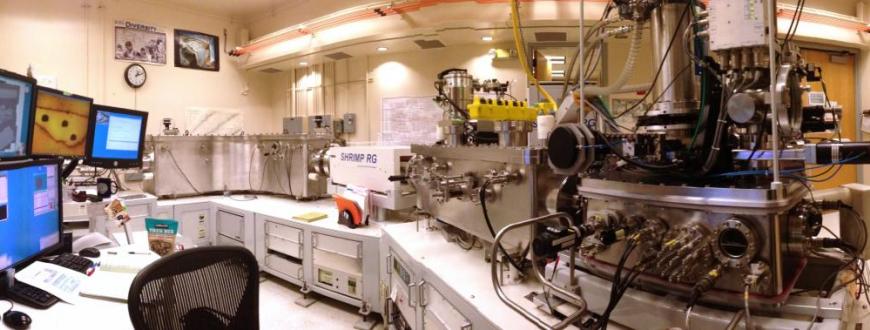
The SHRIMP-RG located at Stanford University
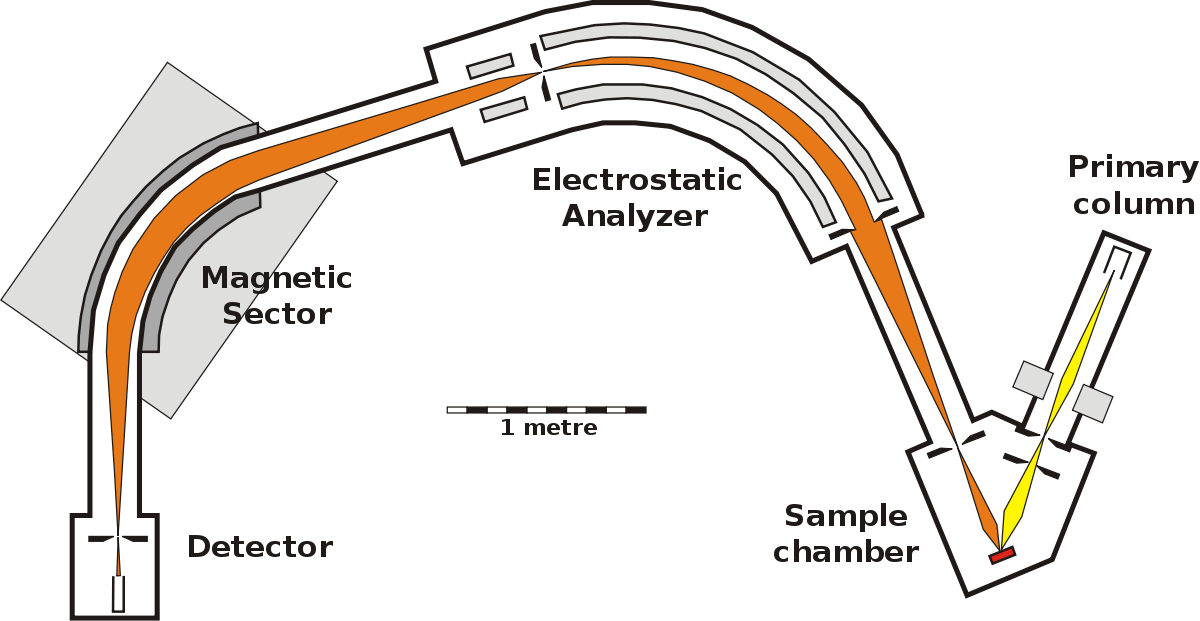
A diagram showing the internal structure of a typical SHRIMP instrument. The ionized oxygen beam is shown in yellow and the path that the ionized sample takes is shown in orange.
The USGS Did You Feel It? shakemap was showing reports coming in from Menlo Park and Palo Alto, so the SHRIMP definitely felt it, too.
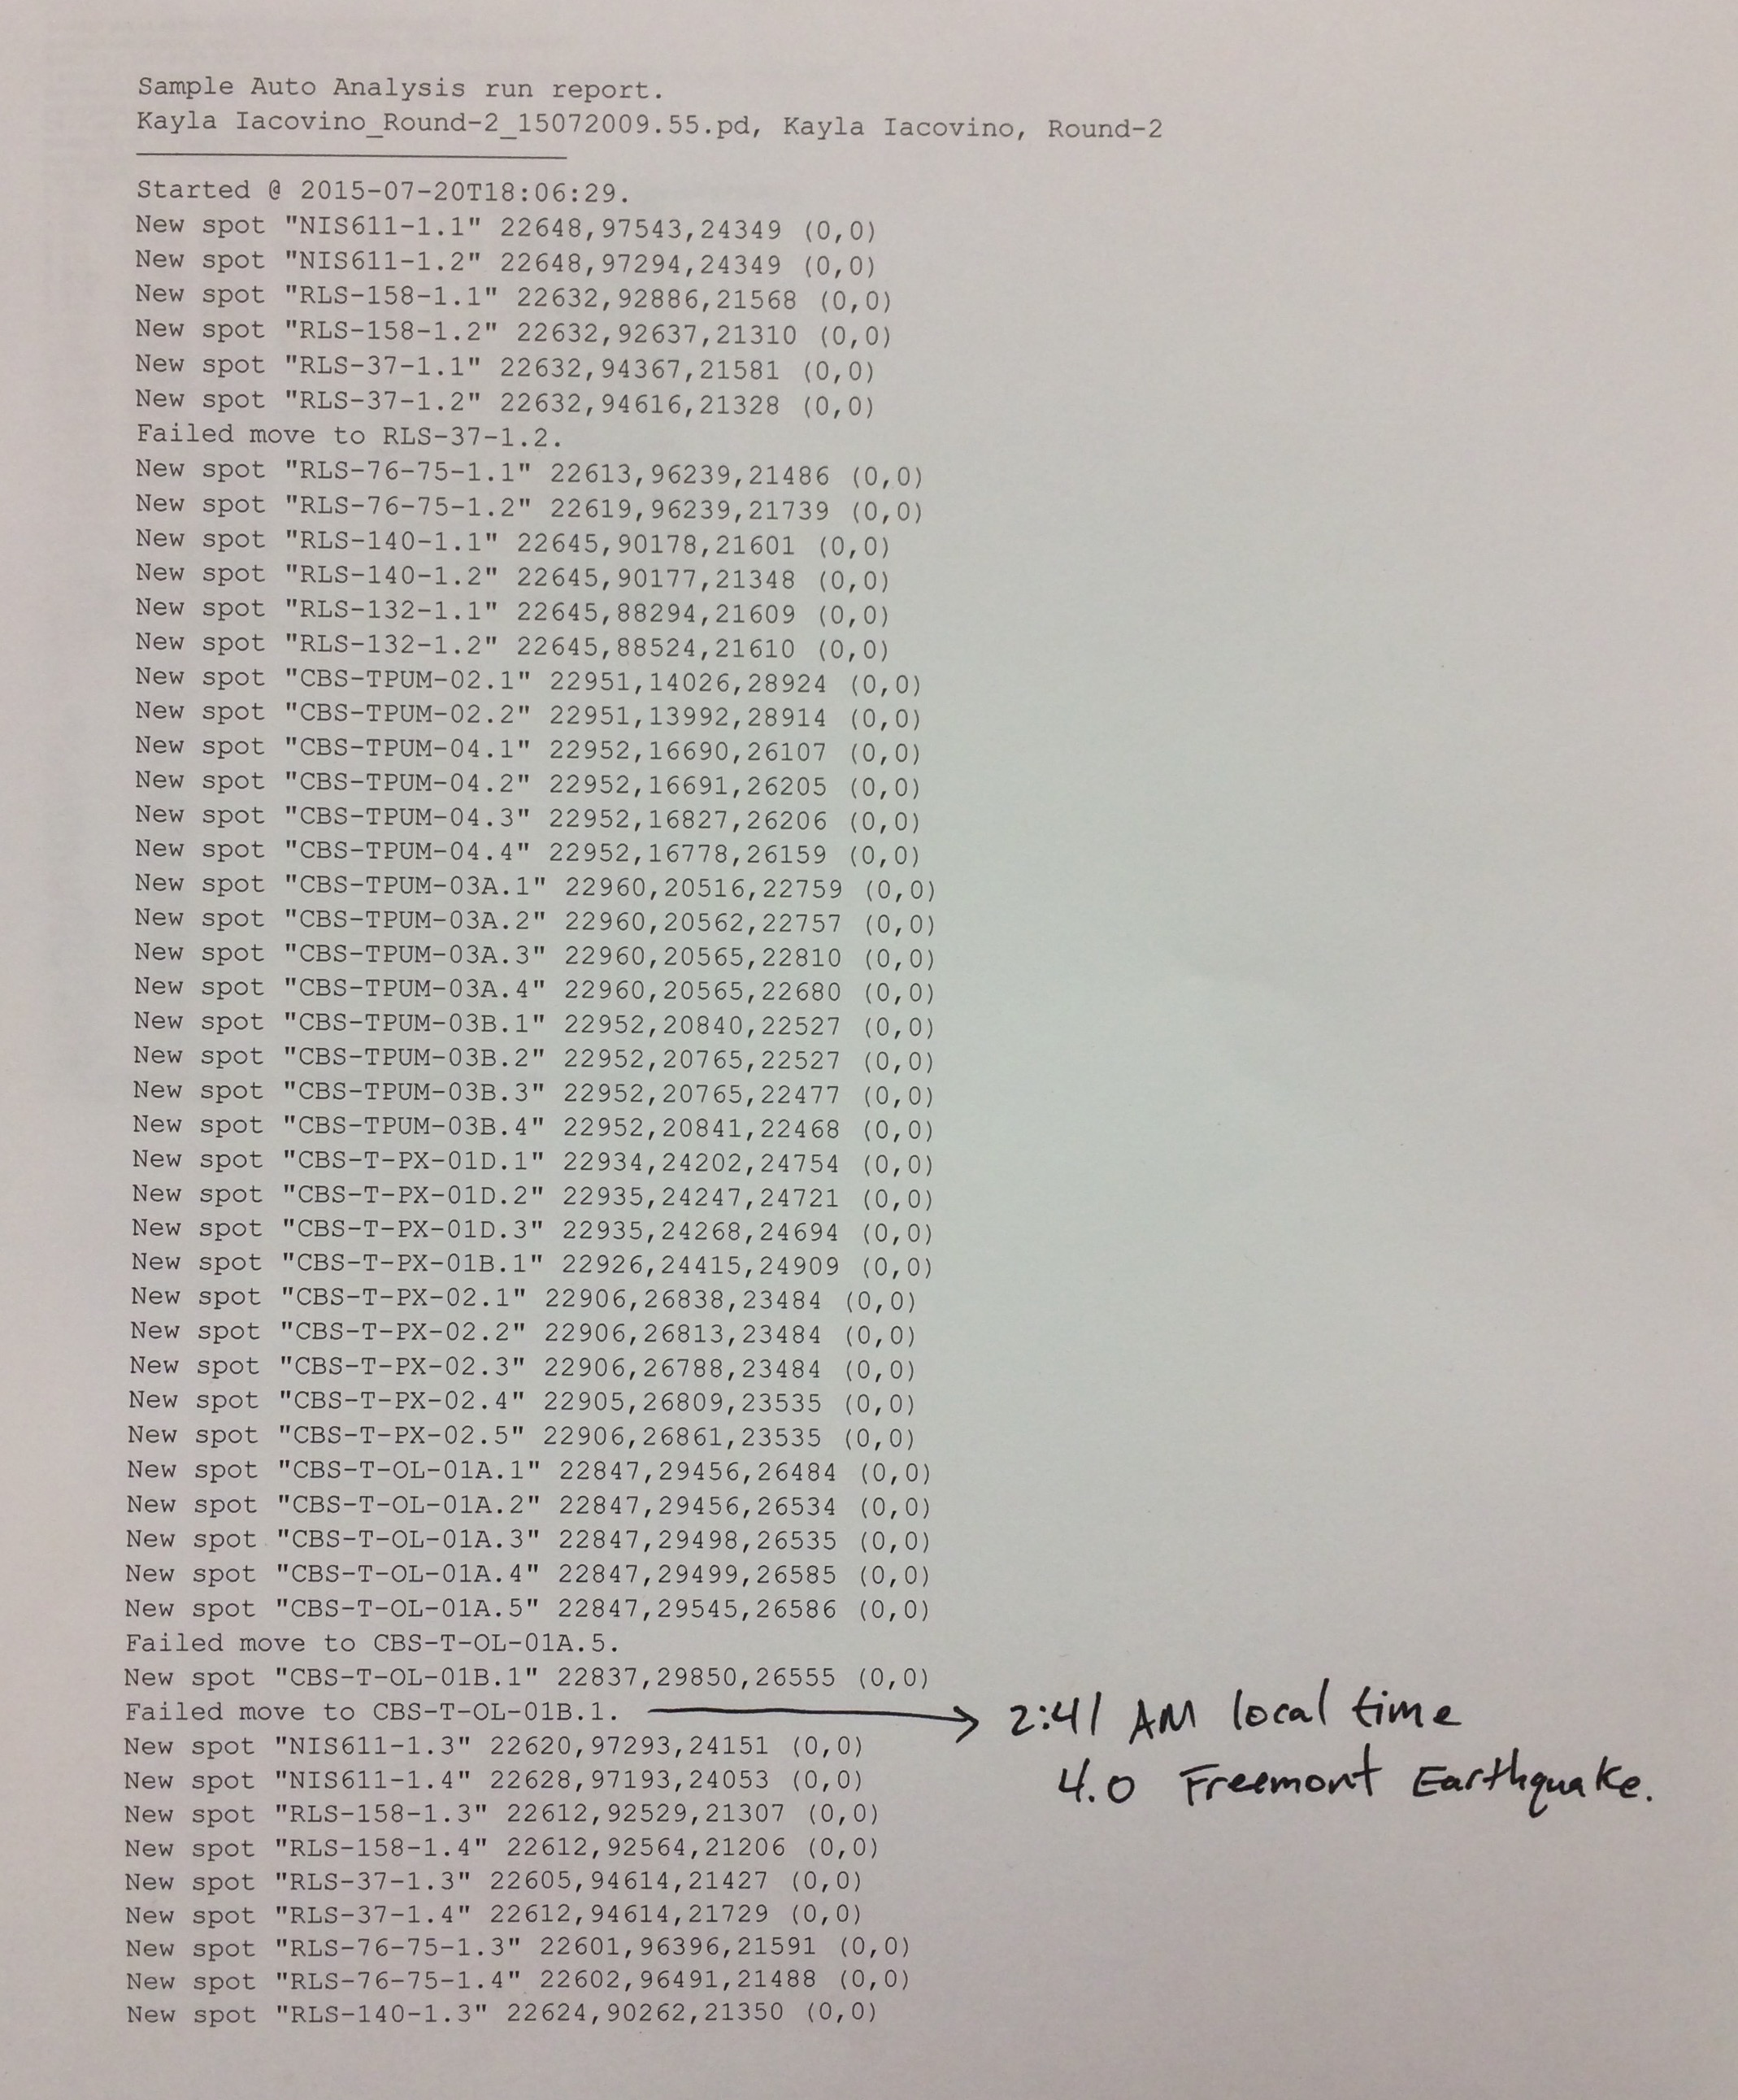
This morning I came into the lab to find nothing in disarray. It was a small earthquake many miles from campus, so I wasn’t worried about major structural damage. The lab director Jorge Vasquez informed me that all of my samples last night ran just fine. Well, with the exception of one point.
“The instrument failed to find the sample spot,” he said, meaning the SHRIMP wasn’t sure it was in the right place to take a measurement. “Sometimes that happens. We can just rerun it now.”
Curious, I checked the time stamps on the analyses before and after the point that failed. Low and behold, the failure occurred right when the instrument would have been moving from one sample, whose analysis began at 02:32am and lasted 9 minutes and 30 seconds, to sample “CBS-T-OL-01B.1”, the sample on which the measurement failed. The following sample measurement was just fine. That one started at 02:45:33, after the shaking had stopped.
Among other things, the SHRIMP uses optical image recognition to determine whether it is situated at the right place to take a pre-programmed measurement. We figure, the shaking occurred either while the instrument was moving to measurement location, which misaligned it badly enough to make the image recognition fail, or the shaking occurred during optical image recognition making it impossible for the computer to know by sight where exactly it was.
Whatever the reason, this is probably the first time that a SHRIMP instrument has been used to record the timing of an earthquake.
UPDATE: Apparently, this isn’t the first time something like this has happened! According to Chuck Magee, the SHRIMP II in Japan was down for half an hour after the Tohoku earthquake.
@eruptionsblog @kaylai Not the first time- The Tohoku quake knocked the NIPR SHRIMP offline for almost half an hour.
— Chuck Magee (@cwmagee) July 22, 2015
Be the first to comment.